AI Discovery
About XM Cyber
XM Cyber is a continuous exposure management platform. It models attacker paths across enterprise networks to highlight critical security risks, spanning Enterprise, Cloud, Active Directory, Vulnerability Management, and Detection.
AI Discovery Overview: Making Shadow AI Visible
Every organization now adopts new AI tools faster than security teams can review them. Employees introduce unapproved applications, and because using an AI tool almost always involves sharing data, each unreviewed application represents a potential data exposure. AI Discovery is a zero-to-one report that transforms raw, invisible shadow AI activity into a scannable, actionable inventory with clear policy management controls.
My Role
Lead UX Designer for AI Discovery (End-to-End).
Partnered with PM, R&D Lead, Technical Content, and Product Marketing to define the 0-to-1 experience.
Owned the information architecture, grouping models, multi-step policy workflows, state coverage, and the production iconography pipeline.
- Information Architecture: Defined how raw endpoint sensor events aggregate into a scannable inventory instead of an unmanageable event log.
- Grouping Model: Established group by tool as the default analytical lens, paired with group by device as a secondary view.
- Policy & Approval Design: Designed and specified the approval and disapproval workflows for tools and individual devices.
- Production Iconography: Owned and delivered the per-tool icon set for production, enabling visual recognition over text reading.
- State Coverage: Specified the report lifecycle from initial scan and empty states through populated inventory and managed policy states.
The Problem
- No Central Visibility: No single location answered which AI tools were running across endpoints and on how many machines.
- No Policy Enforcement Path: Even when usage was identified, teams lacked mechanisms to enforce usage policy or demonstrate compliance to auditors and leadership.
- Raw Events Without Insights: Endpoint sensors generate high volumes of usage events that describe activity without aggregating exposure or risk.
- Invisible Access Channels: A tool accessed through a browser, an installed desktop application, or an MCP server carries a distinct risk profile, yet access channels were unlisted.
- Lack of Usage Trajectory: Without tracking when a tool first appeared and when it was last active, teams could not separate emerging adoption spikes from dormant applications.
- Isolated Entity Context: AI tools represented a new entity type within the platform separate from standard inventory assets, requiring a standalone report design.
Business Goals
- Deliver Executive Visibility: Provide CISOs with defensible data regarding organization-wide AI adoption.
- Establish Category Presence: Address AI compliance ahead of competitors to retain current accounts and attract new enterprise clients.
- Provide Audit Evidence: Ensure usage data is exportable and logged, allowing security teams to demonstrate policy compliance to auditors.
- Integrate Existing Workflows: Complement hygiene management workflows without disrupting current operational processes.
- Combine Visibility with Enforcement: Deliver accurate discovery data alongside actionable policy controls to manage unapproved tool usage.
Target Audience
CISOs and enterprise security teams responsible for AI usage policies, audit readiness, and compliance reporting.
User Persona
- The Security Reviewer: Needs to grasp the scope of AI usage in seconds and identify high-risk tools requiring investigation, working from high-level breadth down to detail.
- The Compliance Owner: Needs exportable evidence and an audit trail proving that AI usage is monitored and policy decisions are formally recorded.
Research & Discovery
- An Emerging Category: No established competitor patterns existed for AI usage inventories, meaning the interface could not be benchmarked against an incumbent product.
- Data-Shape Constraints: The design was structured around endpoint sensor collection limits across browser extensions, MCP servers, and installed applications, requiring an architecture that accurately reflected endpoint coverage.
- Cross-Functional Alignment: Partnered with the product manager, R&D lead, and QA to establish the core inventory capabilities and data processing pipelines.
Product Goals
- Summarize Before Detail: Lead with plain-language scope metrics before presenting the scannable table.
- Group by Unit of Decision: Display one row per tool, aligning with how security policy is evaluated and set.
- Surface Risk Context Inline: Expose access channels and blast radius directly in the main table row rather than hiding them in secondary panels.
- Recognition Over Reading: Treat iconography as UI infrastructure that accelerates table scanning.
- Design for Long-Term Scalability: Structure the report layout so risk scoring and expanded policy enforcement controls can integrate seamlessly.
Solution
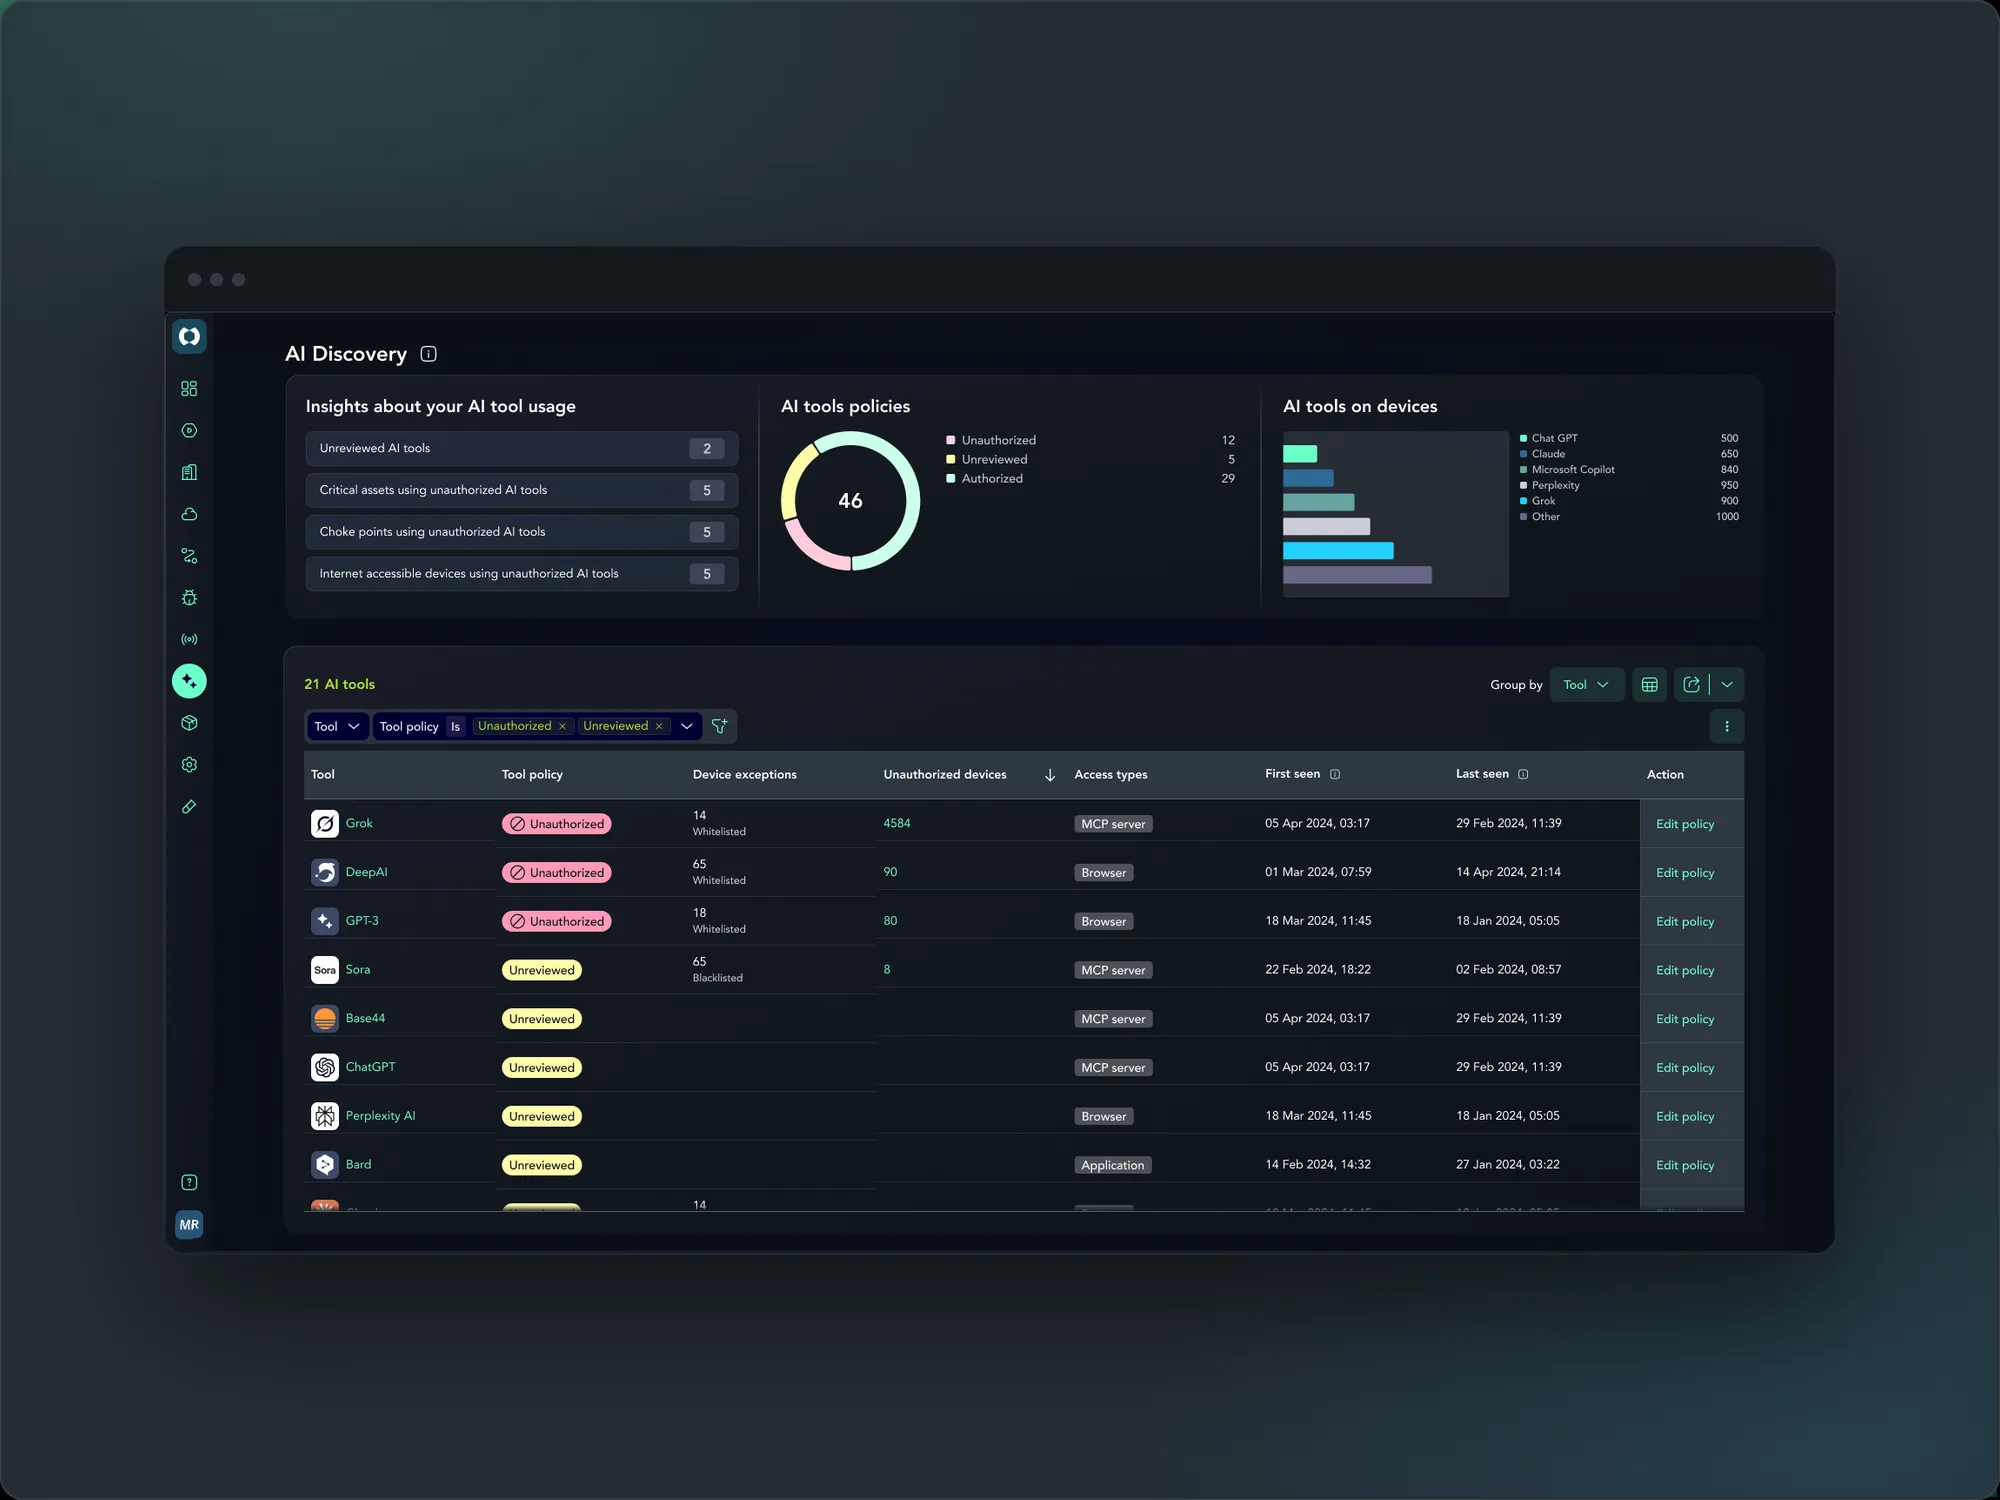
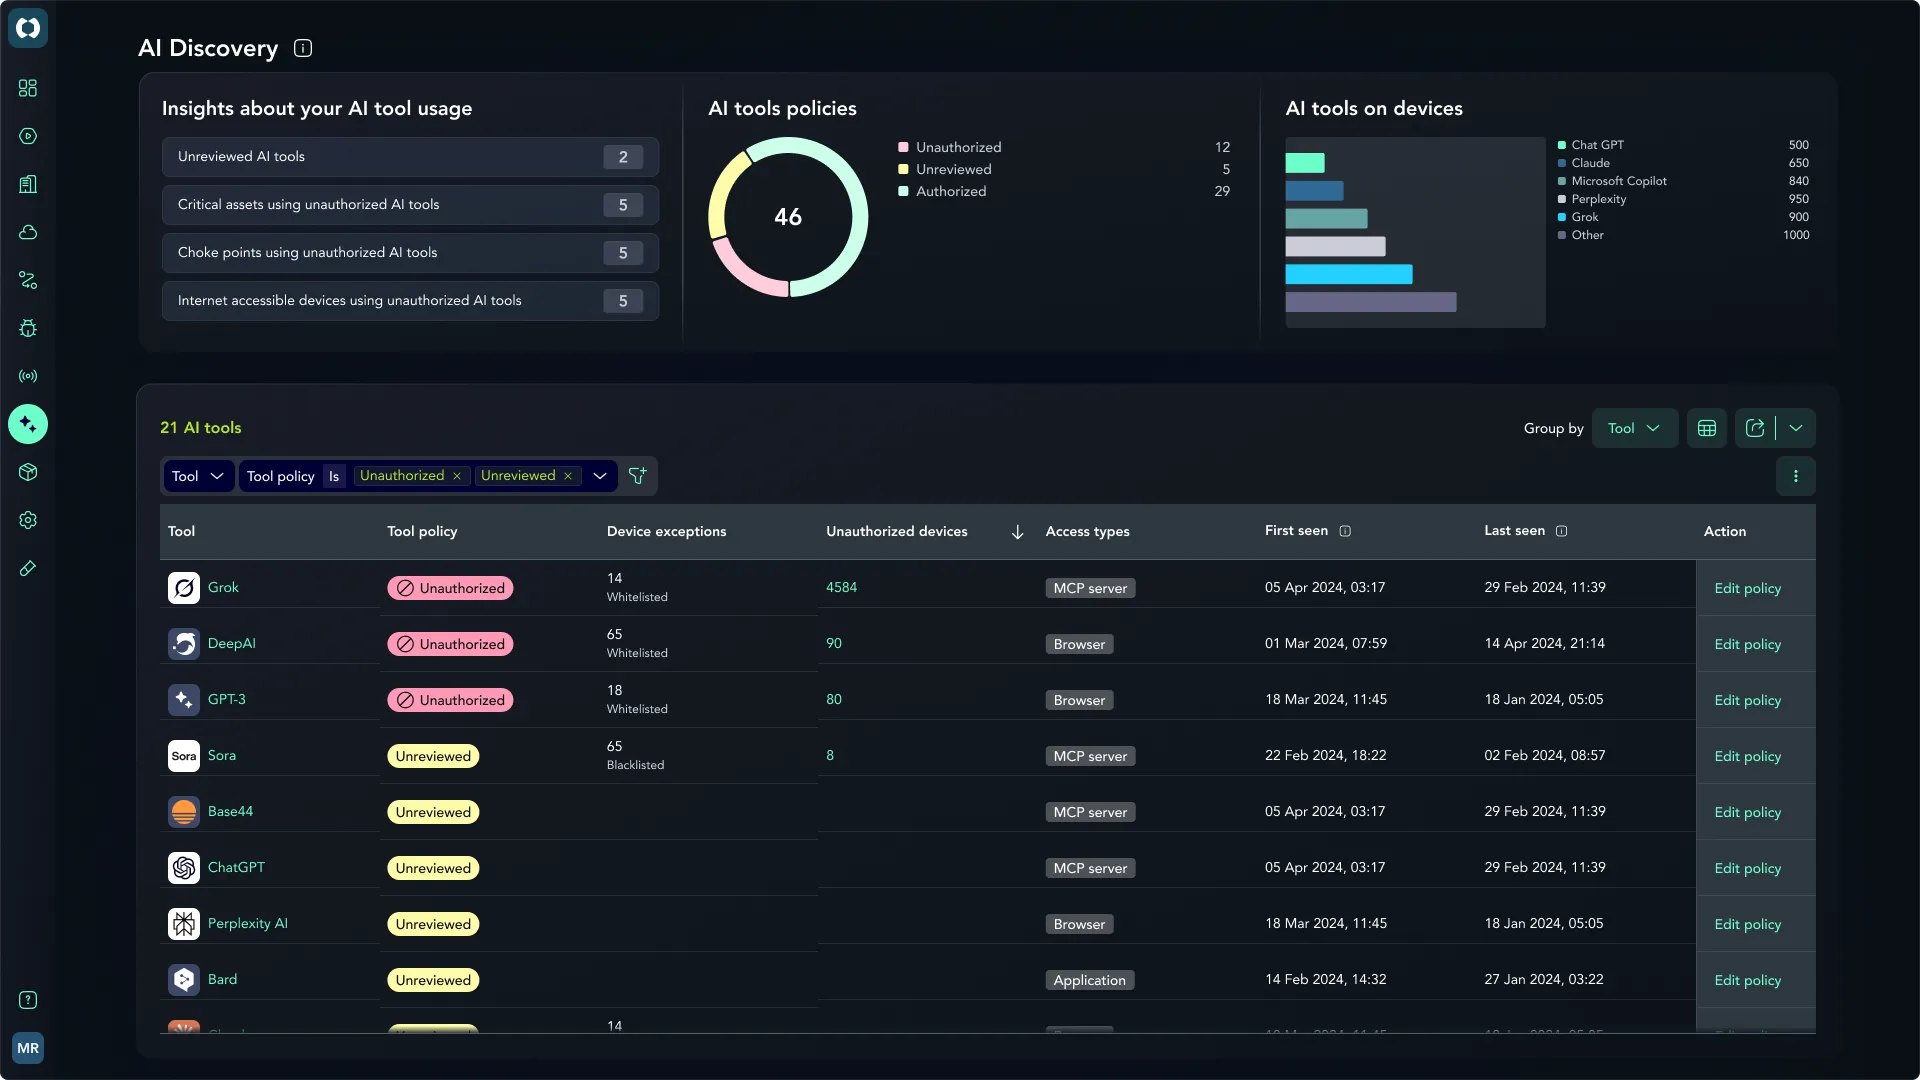
Roll Up Events to 'One Row Per Tool' (Default Analytical View)
Established group by tool as the default view, using total device count as a direct blast radius signal.
- Rationale : Security teams evaluate policy at the application level before investigating individual hosts. Grouping by tool reduces thousands of event logs into an actionable N-row inventory.
- Trade-off : Per-device details move down one level in the hierarchy, addressed by providing group by device as a dedicated secondary view.
Access Type as a Core Column
Exposed whether a tool is accessed via a browser, installed application, or MCP server directly within the table row, accompanied by an indicator when a tool spans multiple channels.
- Rationale : Access channels alter risk profiles significantly, making inline visibility essential for immediate decision-making.
Dual Timestamps (First Seen & Last Seen)
Implemented two distinct timestamps within the table view.
- Rationale : A single timestamp cannot differentiate between a newly spreading tool and a dormant application.
Production-Ready Iconography
Designed and delivered a dedicated per-tool icon library directly into production assets.
- Rationale : In data-dense tables, visual recognizability speeds up scanning, allowing users to process rows visually rather than reading text labels.
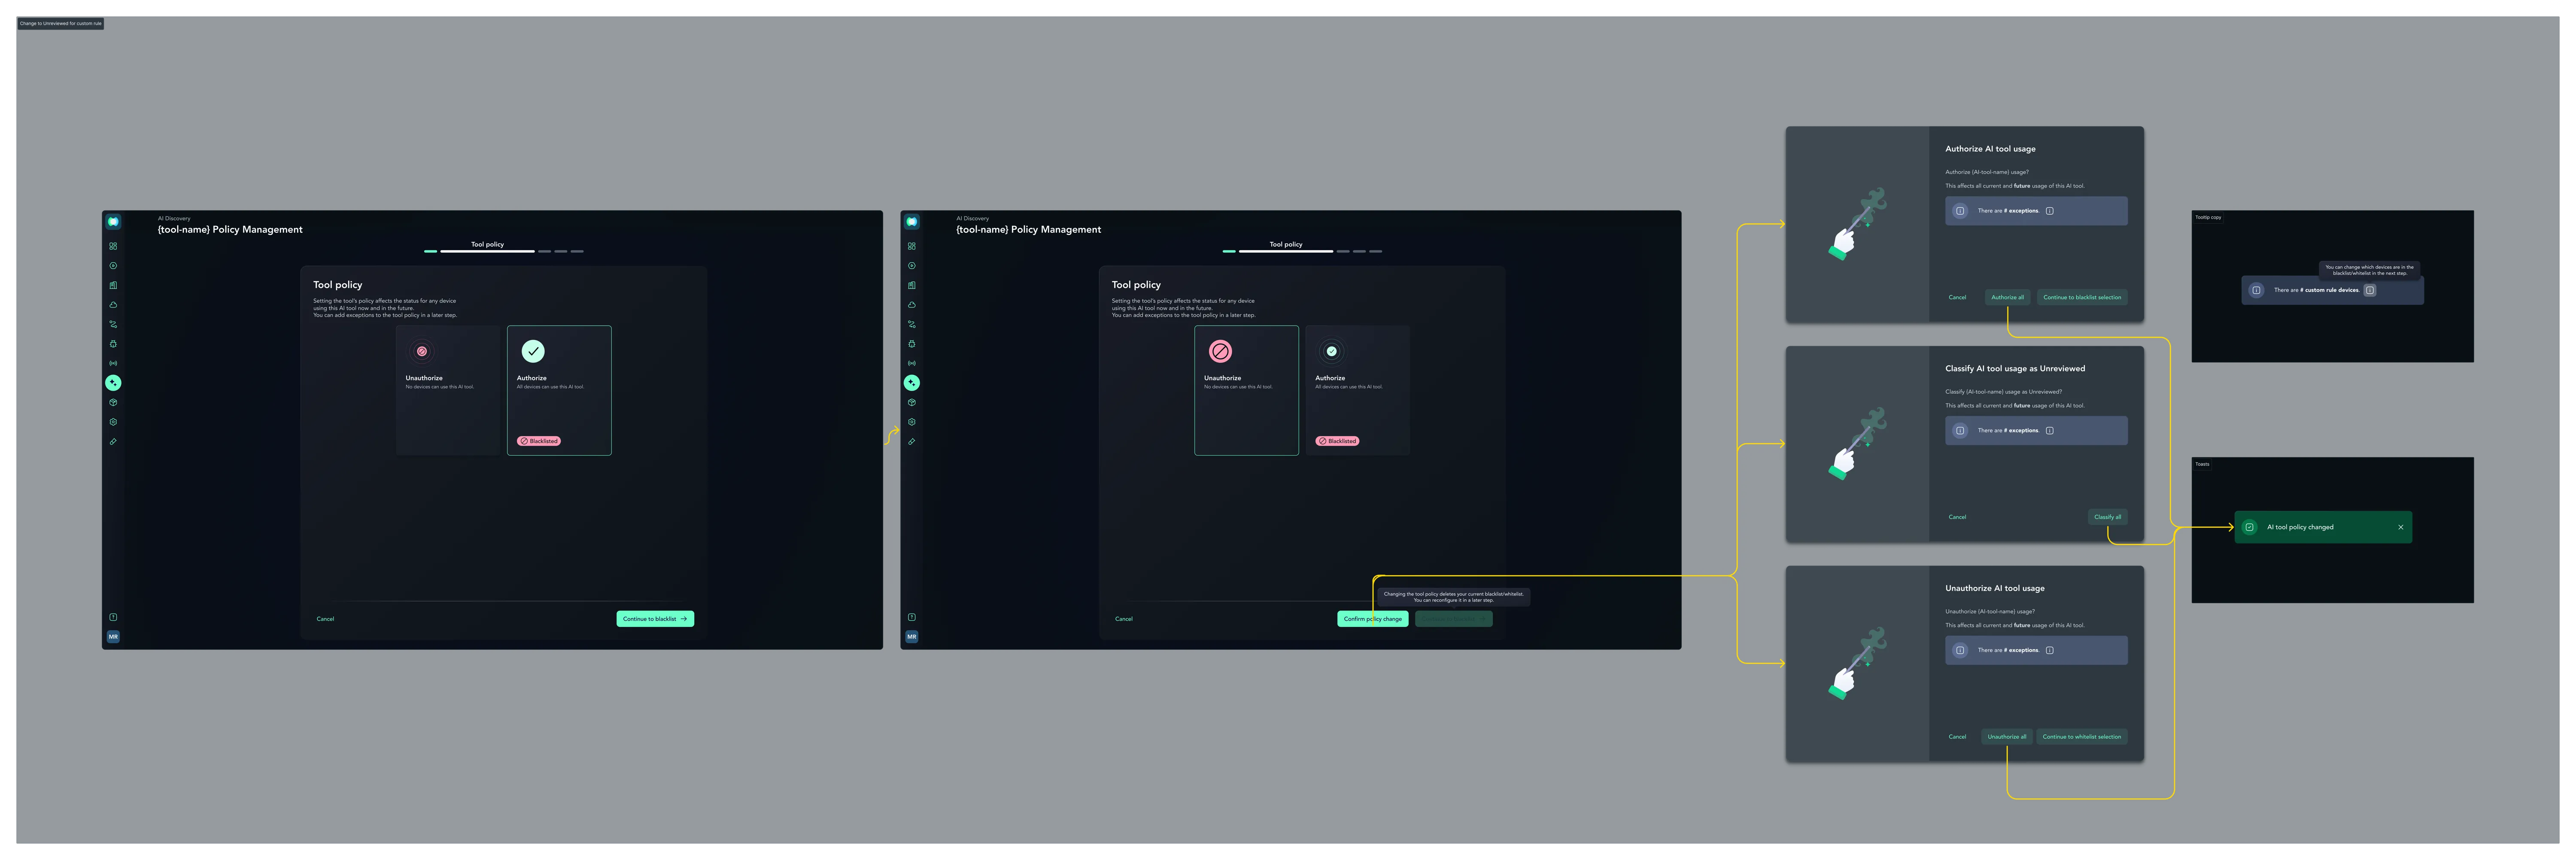
Policy & Approval Workflows
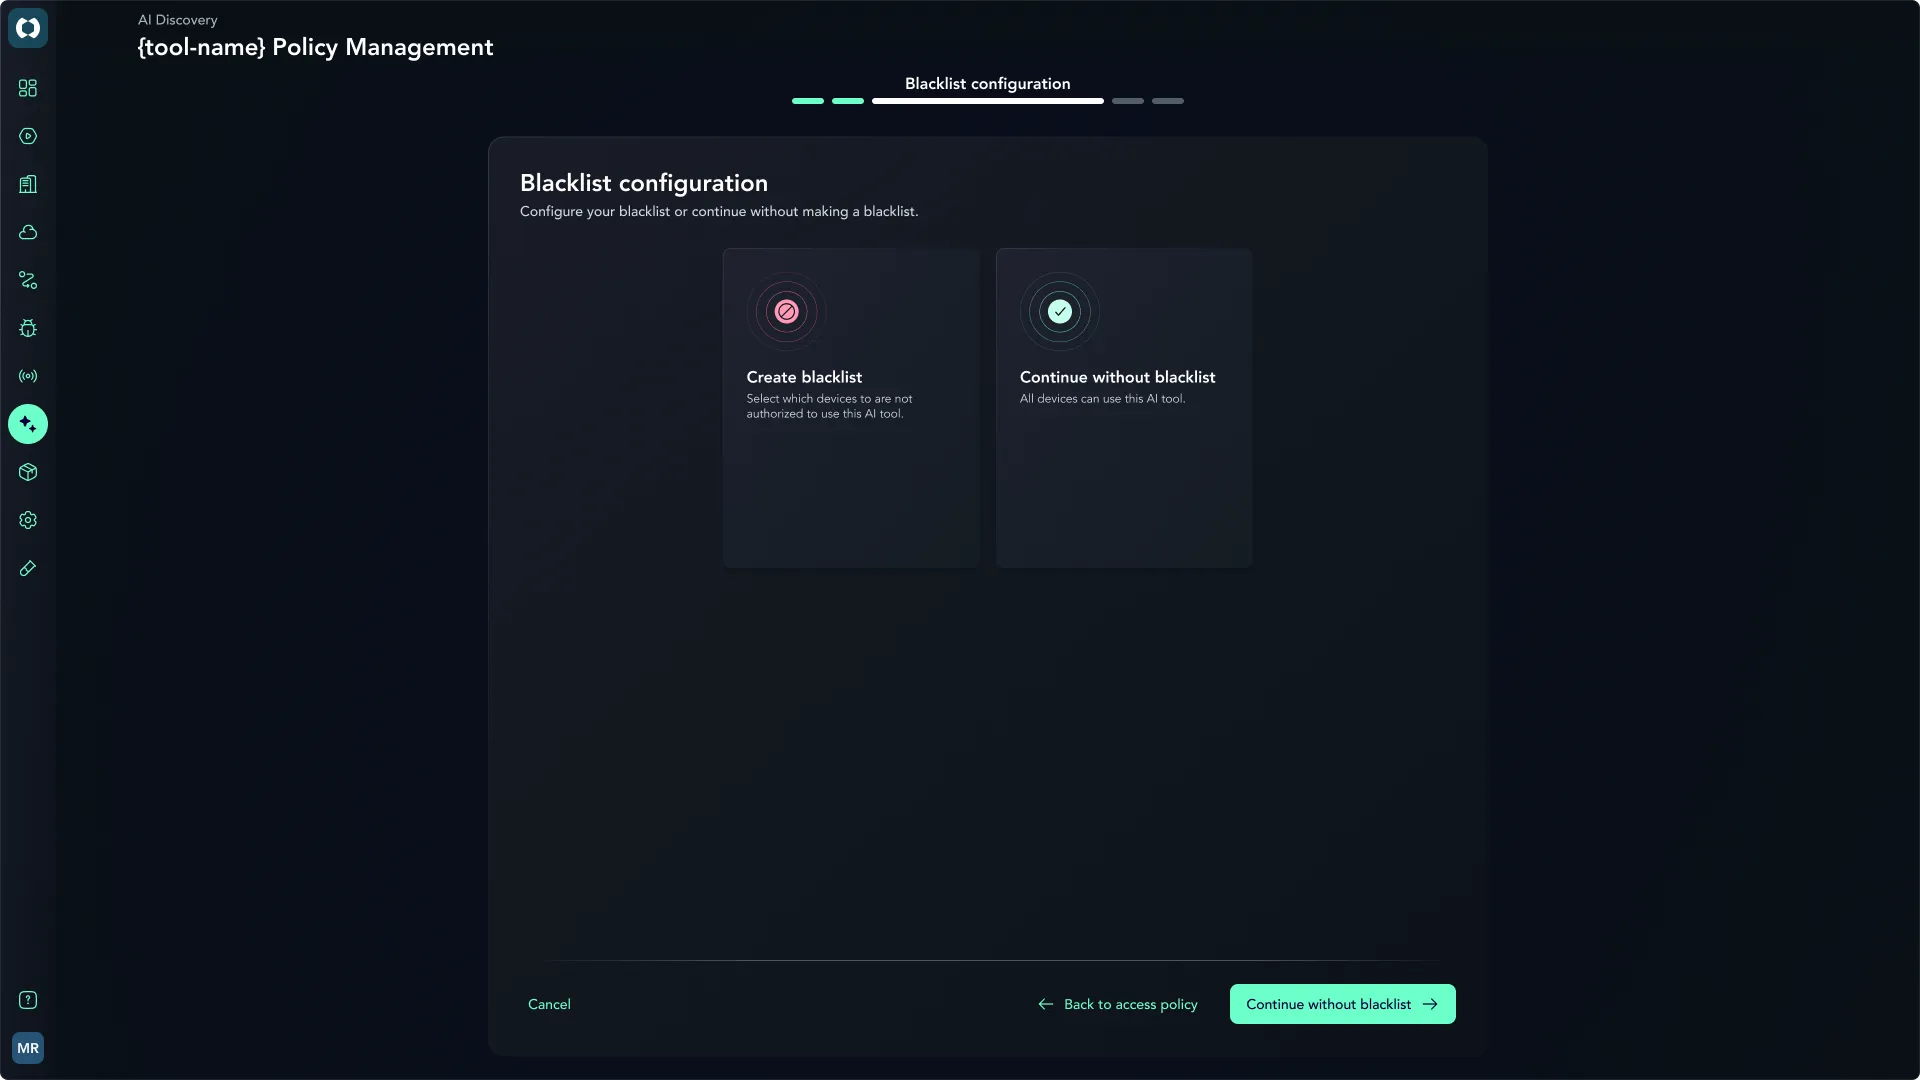
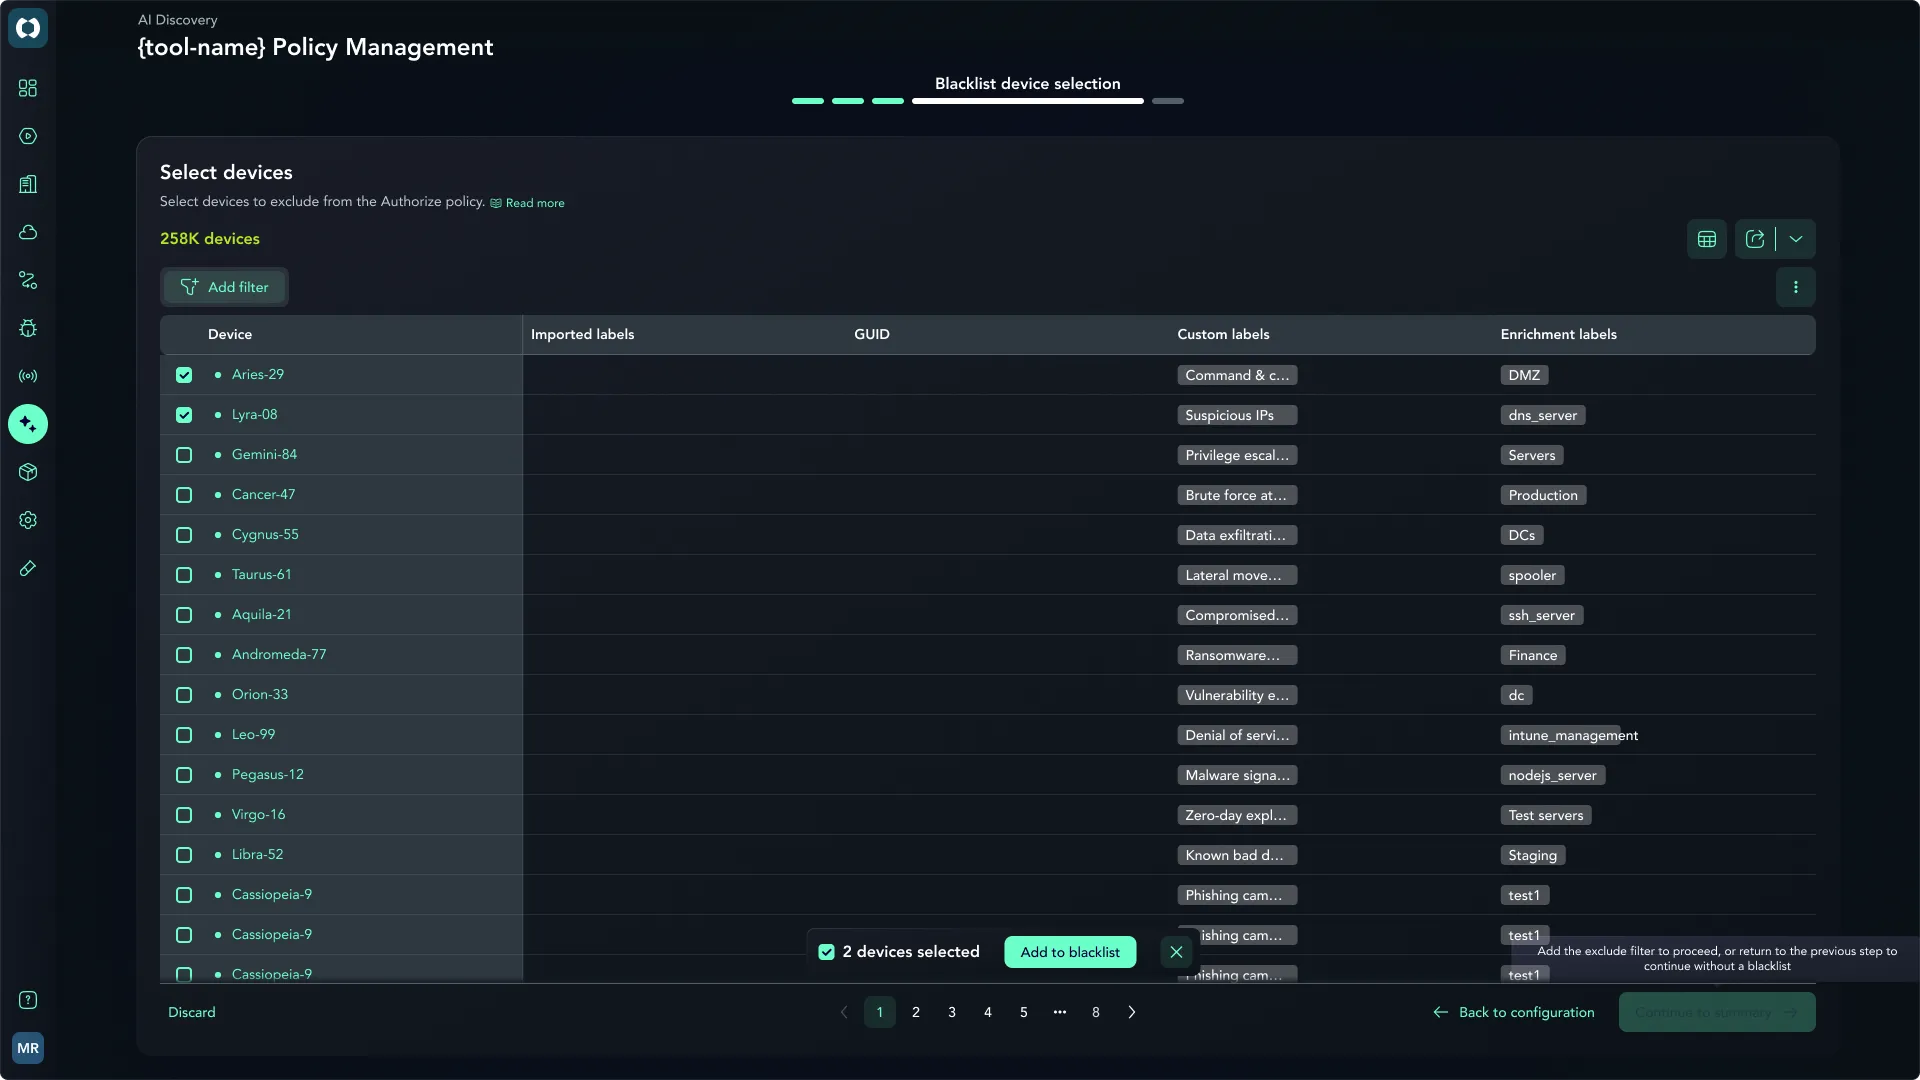
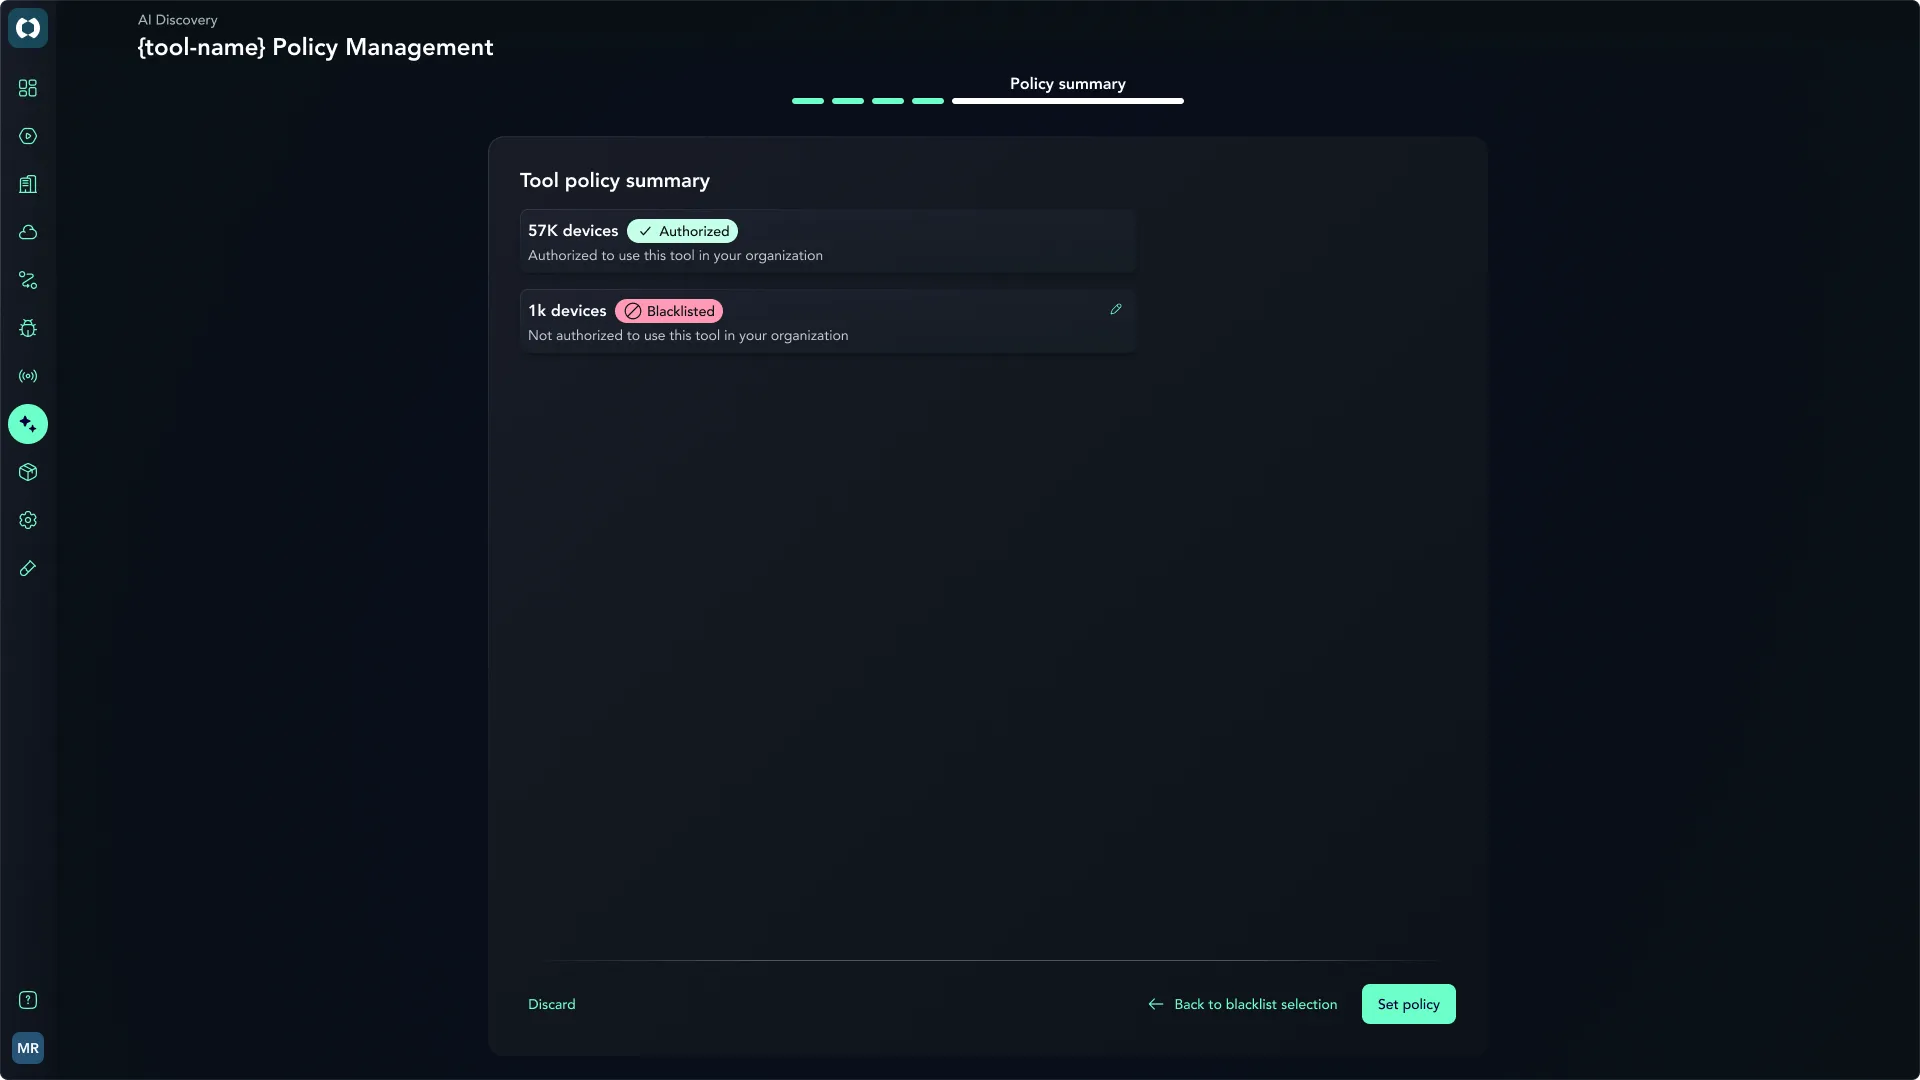
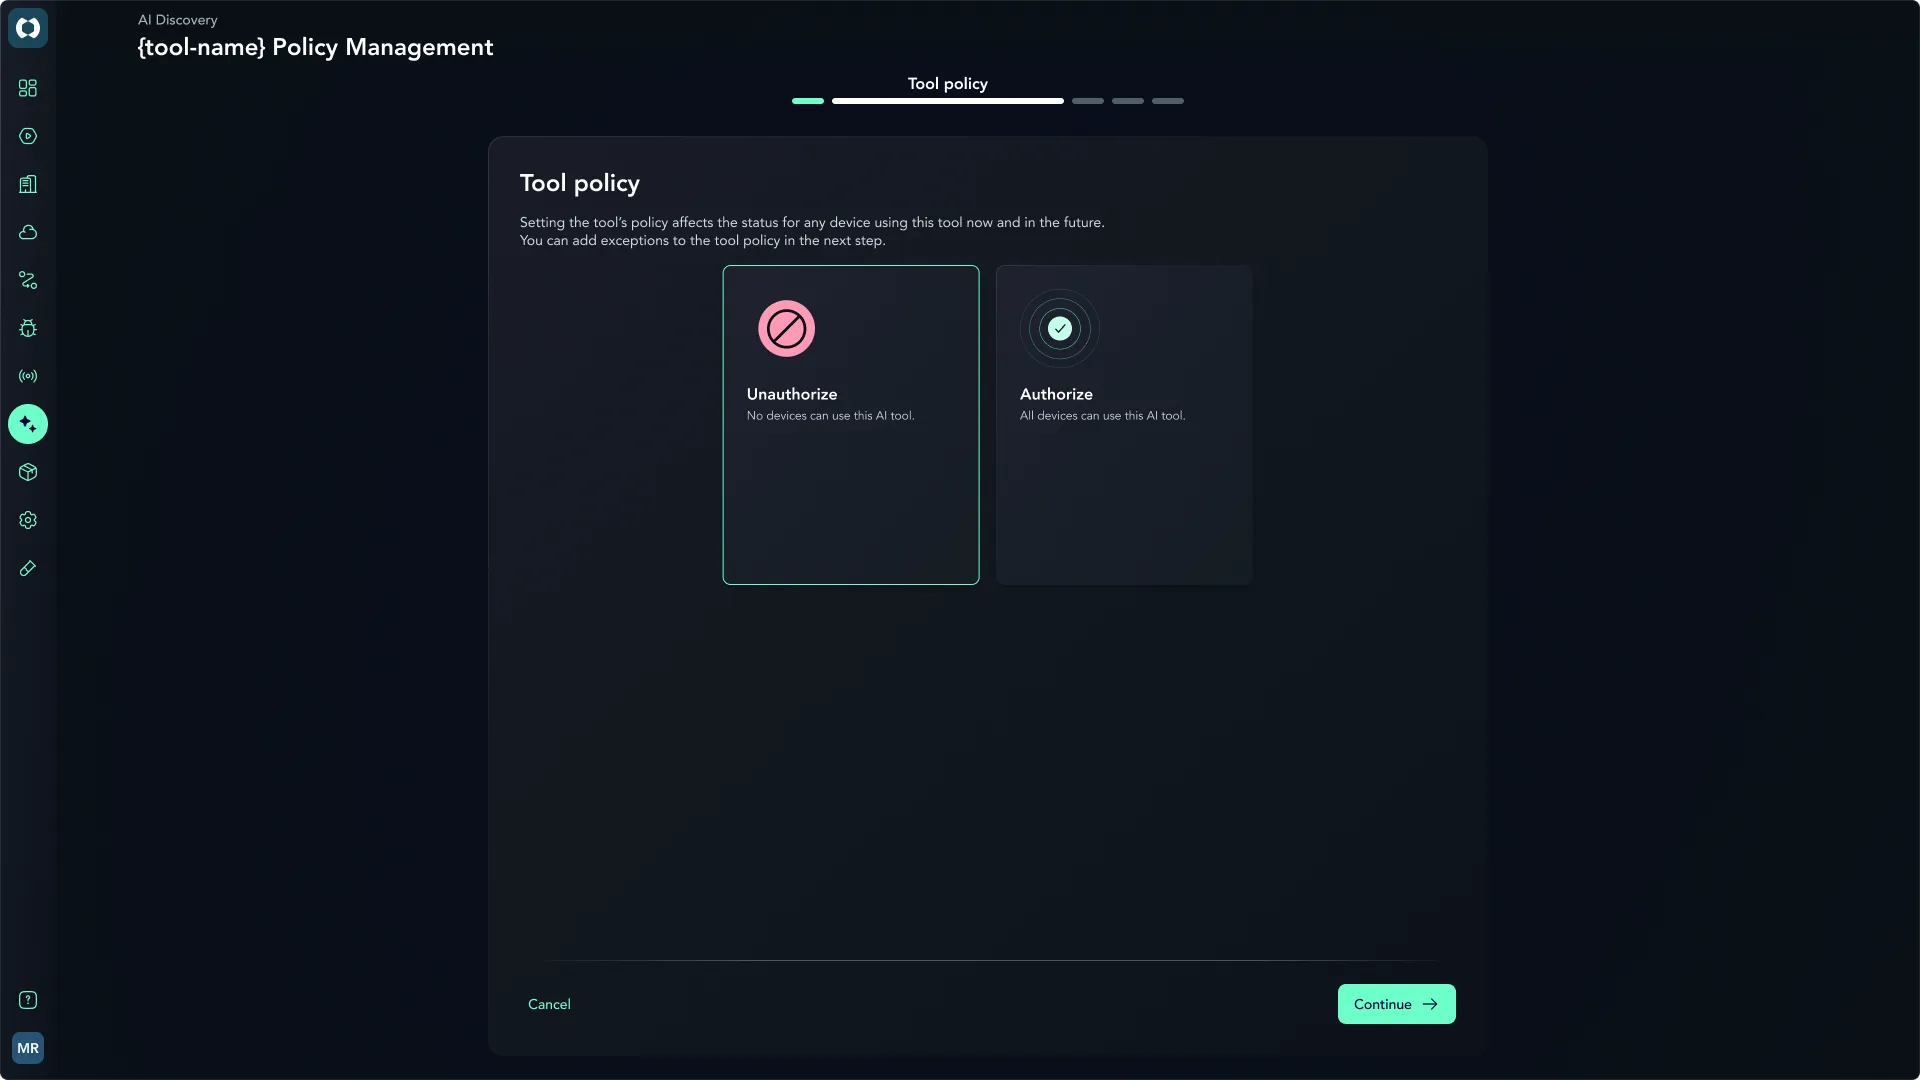
Specified inline action mechanics to mark a tool, or specific devices running it, as approved or unapproved directly within the inventory.
- Rationale : Coupling visibility directly with policy controls allows security teams to transition from discovering shadow AI to managing it in a single workflow.
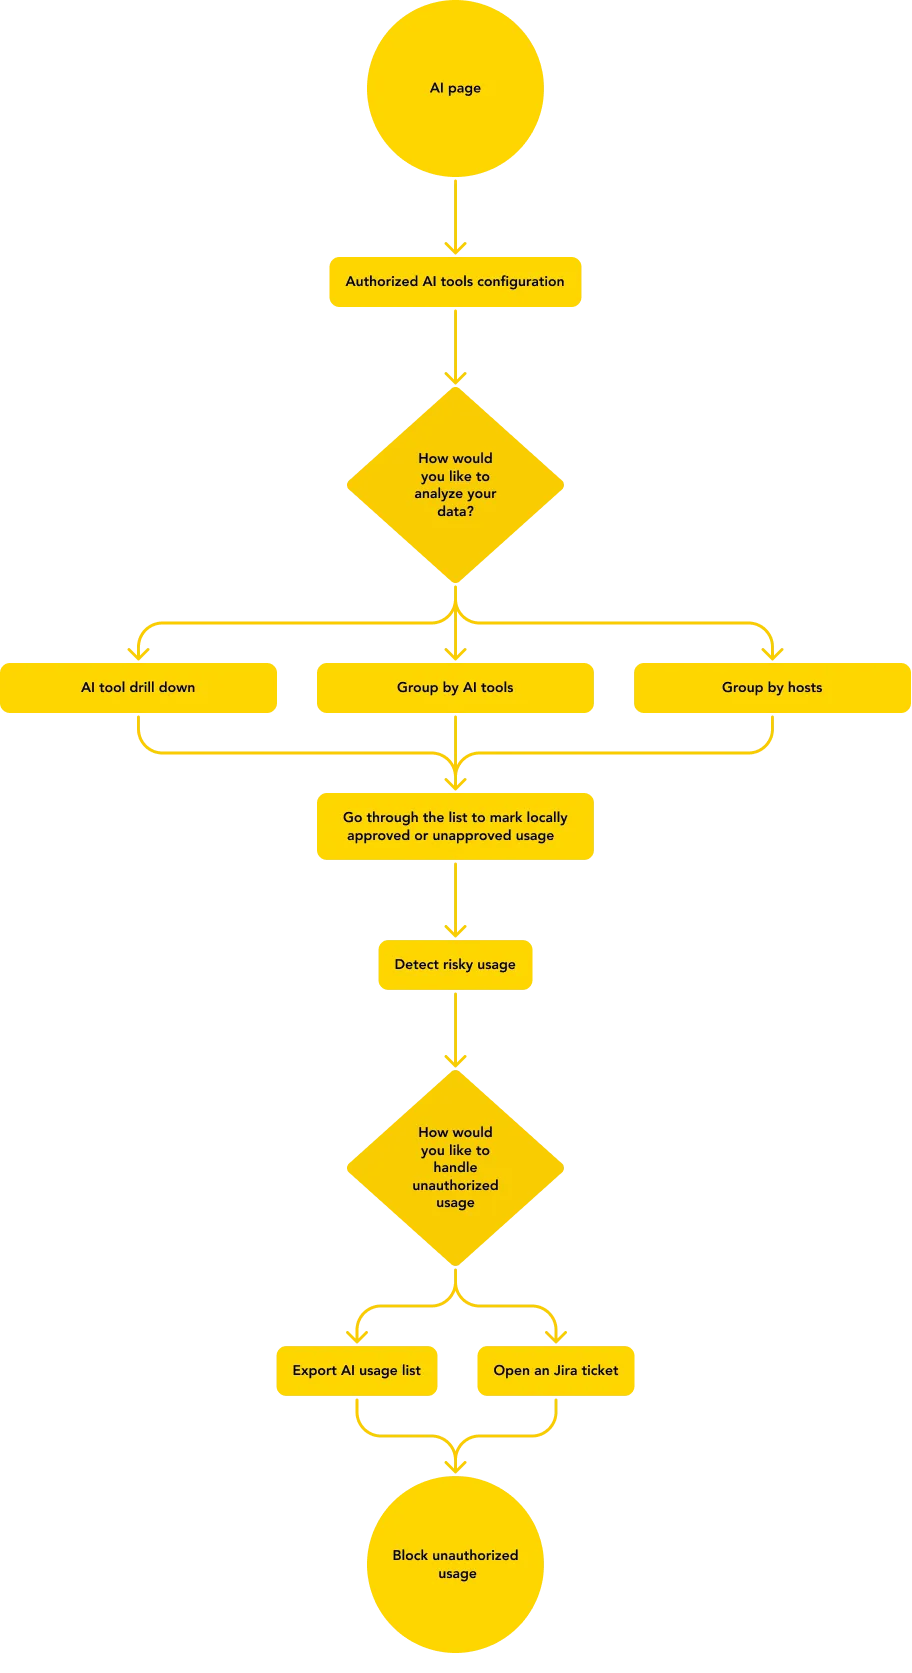
UX Flow
Old Flow :
- No dedicated view existed
- AI usage remained invisible
- Risk posture could not be demonstrated.
New Flow :
- Open report
- Review plain-language scope summary
- Scan tools by device count and access type
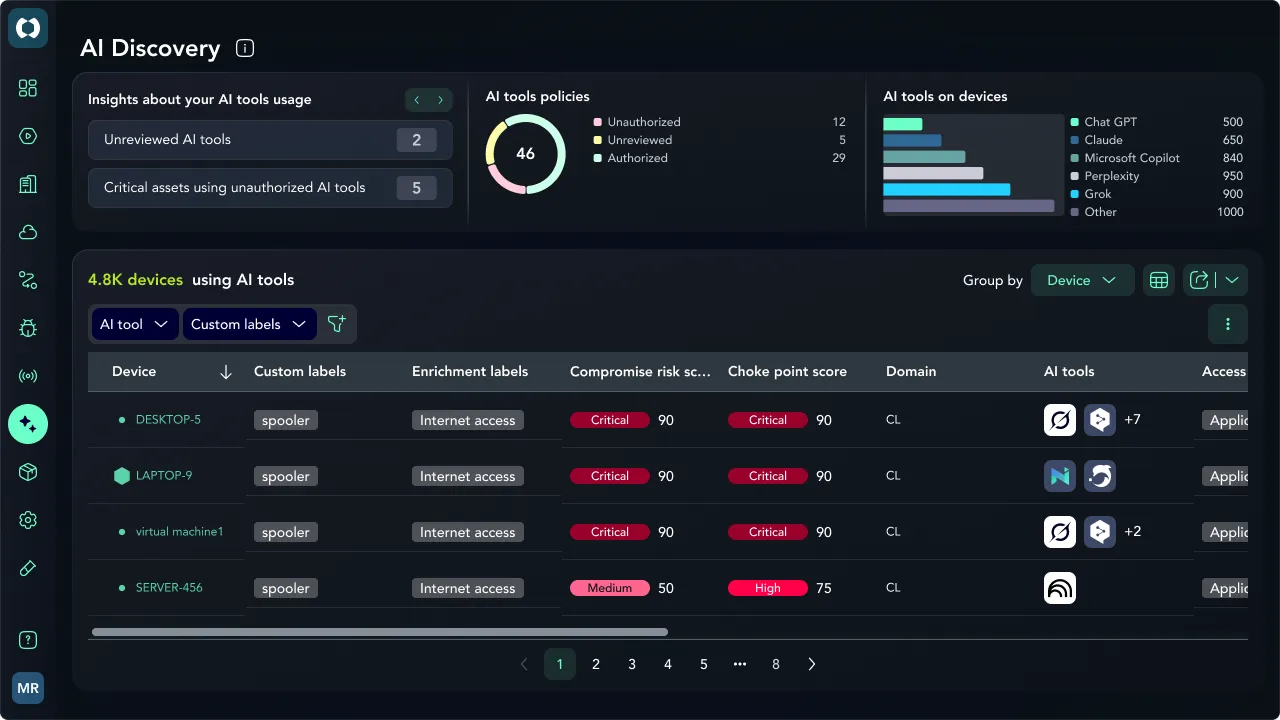
- Pivot to group by device for granular investigation
- Apply policy approval or export data for compliance audits.
Outcome & Status
- Live Platform Feature: The report powers AI discovery, data enrichment, main inventory tables, group-by-device views, policy management workflows, audit logs, and data exports.
- Verified Coverage: Actively discovers and manages AI tools across application, browser, and MCP server channels.
Initial Measurements & Telemetry
The measurement framework follows an adoption ladder defined with the product manager, evaluating feature engagement from initial discovery to workflow integration:
- Adoption Funnel: Tracking user progression from initial awareness to first-time review, single-use, and recurring usage.
- Grouping View Preference: Monitoring default view start rates versus pivots to group by device, validating whether the initial aggregation model aligns with user workflows.
- Export Frequency: Serving as a proxy for compliance value, measuring how often the report is exported as audit evidence.
- Policy Action Frequency: Tracking how often tools or devices are marked as approved or unapproved to measure active policy enforcement.
- Impact: Adopted by enterprise security teams within the first month of rollout, directly unblocking AI compliance audit requirements for major accounts.
UI Designs
Inventory Table & Filter Bar – Aggregating multi-channel usage into a tool-first analytical view.
Responsiveness - 1280px width screen
Step 1: Policy Selection – Allowing admins to set binary authorization statuses.
Step 2: Exception Handling – Configuring blacklists/whitelists per device group without breaking global rule.